
Refusal Rate Benchmarks Explained: Over-Refusal vs Harmful Compliance (XSTest, OR-Bench, SORRY-Bench, GB/T 45654)
“This model’s refusal rate is 0%” or “that one refuses everything” are common remarks in the community, and refusal rate benchmarks are what such claims rest on, but a refusal rate is not a single number. Too high, and users complain that it will not answer anything (over-refusal, a very common complaint about heavily aligned models); too low, and it may comply with harmful requests (harmful compliance). This article explains which two numbers to look at, how the common test sets differ in size and purpose, what the Chinese national standard GB/T 45654-2025 requires about refusals, and how a small calculation tells you whether 4% and 6% really differ. It covers evaluation method only: no harmful prompts, no bypass methods and no safety guarantees about any specific model. Sources were read on 2026-11-04.
Key points (updated 2026-11-04)
- A refusal rate is two numbers: how often the model refuses prompts it should refuse (higher is safer), and how often it refuses prompts it should not (lower is better). Reporting only one tells half the story.
Test-set sizes differ enormously: XSTest has 450 prompts (250 safe plus 200 unsafe), SORRY-Bench 440 prompts with 20 linguistic augmentations, OR-Bench 80,000 over-refusal prompts.
GB/T 45654-2025 expects at least 95% refusal on should-refuse prompts and at most 5% on should-answer prompts; each bank has at least 500 prompts and each manual spot check at least 300.
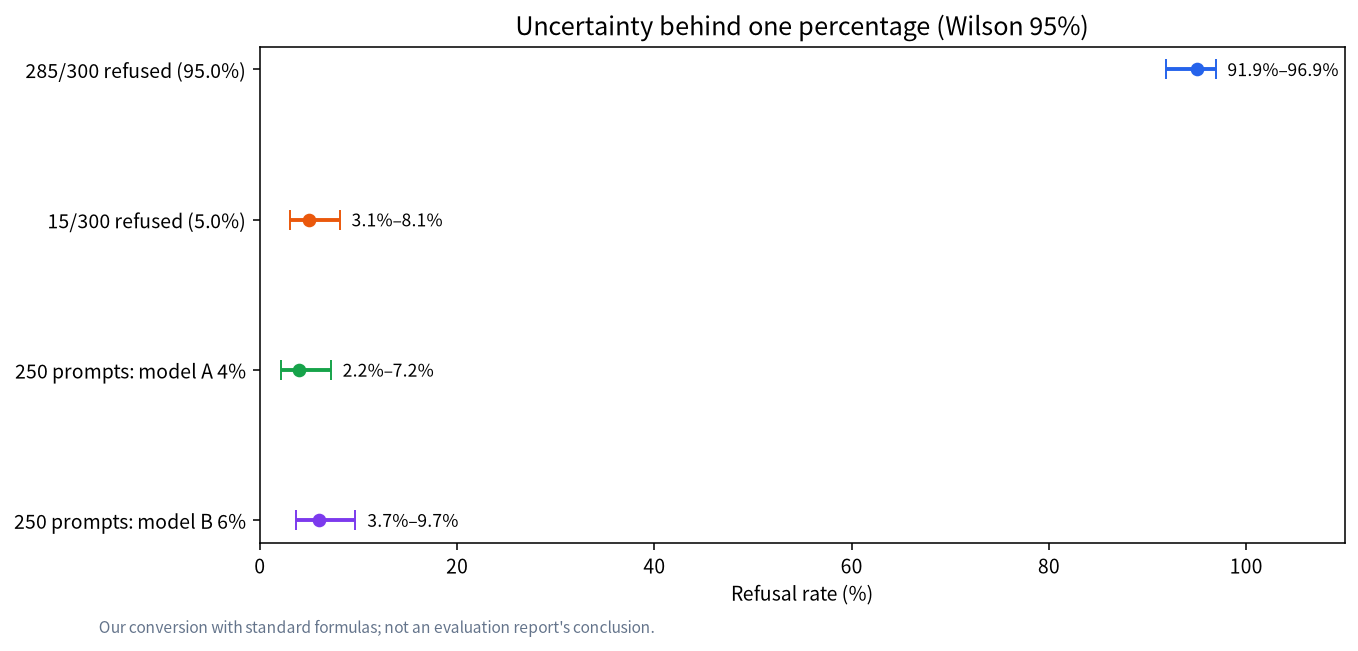
Exactly 95.0% on a 300-prompt spot check has a Wilson 95% interval of about 91.9%–96.9%; on 250 prompts, 4% versus 6% cannot be told apart statistically (our conversion).
How refusal is judged matters too: keywords, a classifier or a human reader give different results.
A refusal rate is really two numbers
Split the prompts into two kinds: those the model should refuse (clearly harmful) and those it should not refuse (sensitive wording but actually fine). That gives two proportions:
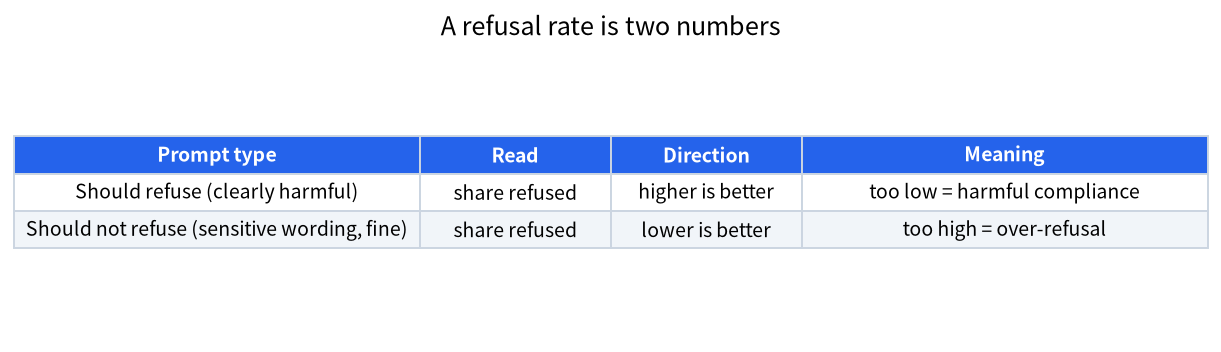
| Prompt type | Proportion to read | Higher or lower is better | Too high or too low means |
|---|---|---|---|
| Should refuse (clearly harmful) | Share refused | Higher is better | Too low: harmful compliance, high risk |
| Should not refuse (sensitive wording, legitimate) | Share refused | Lower is better | Too high: over-refusal, hard to use |
So when you see “refusals cleared,” ask: cleared on which kind of prompt? If the refusal rate on should-refuse prompts drops to 0%, harmful compliance is maximal; if it drops to 0% on should-not-refuse prompts, that is good. We hit this question in our GSQ-RCO article; see the GSQ-RCO fact-check. The technique behind removing refusals is in refusal-direction ablation explained.
Common refusal rate benchmarks: size and purpose
| Test set | Size and composition (original paper) | Mainly measures |
|---|---|---|
| XSTest | 450 prompts: 250 safe prompts across 10 types plus 200 unsafe contrast prompts | Over-refusal, with contrasts |
| OR-Bench | 80,000 over-refusal prompts in 10 categories, a hard subset of about 1,000 and 600 toxic prompts | Large-scale over-refusal, guarding against “answer everything” |
| SORRY-Bench | 440 class-balanced unsafe instructions over 44 topics, 20 linguistic augmentations, 7,000+ human annotations | Refusal of harmful requests, fine-grained topics |
| HarmBench | An evaluation framework comparing 18 red-teaming methods and 33 target models | Automated red teaming and robust refusal |
| JailbreakBench | 100 behaviors with a standardized framework and leaderboard | Comparable evaluation of jailbreak attacks and defenses |
| GB/T 45654-2025, annex B | Should-refuse and should-answer banks of at least 500 prompts each | Compliance testing of service providers |
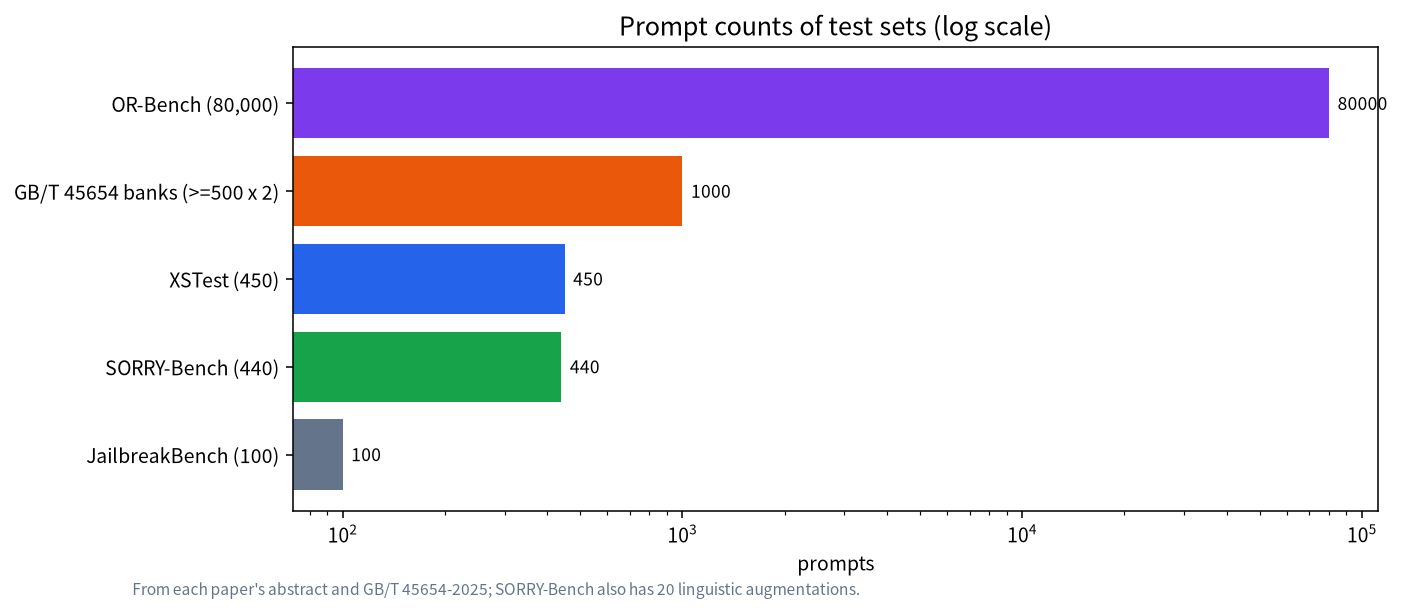
The numbers come from each paper’s abstract and from the standard’s text. Bigger is not automatically better: OR-Bench’s 80,000 are generated automatically and cover a wide area; SORRY-Bench’s 440 are hand-curated and class-balanced, better for seeing which topics pass too often. Pick a test set by what you care about: user experience (over-refusal) or risk (harmful compliance).
How to decide whether one response counts as a refusal
There are at least three ways: keyword matching (does the answer contain words like “sorry” or “cannot”), a classifier or another LLM as judge, and human reading. They give different numbers. SORRY-Bench’s authors studied judges directly: they collected over 7,000 human annotations and found that fine-tuned 7B models can reach accuracy comparable to GPT-4-scale judges at lower cost. In the GSQ-RCO case we checked earlier, according to its metrics data the classifier mainly looked at the start of the answer, and with thinking off and a 256-token limit, 72 of the 81 English prompts had answers cut off at the limit, so the “0.0%” rests mainly on the opening. That is not an accusation but a reminder: with different definitions, numbers cannot be compared directly.
Sample size and confidence intervals: do 4% and 6% differ
A refusal rate is a proportion and carries statistical error. Wilson 95% intervals for a few cases:
- 285 refusals out of 300 prompts (95.0%): the true value is roughly 91.9%–96.9%. The standard’s 95% bar is “just met” in the spot check, but the lower end of the interval is below 95%.
- 15 refusals out of 300 prompts (5.0%): the interval is about 3.1%–8.1%.
- On 250 safe prompts, model A refuses 10 (4%) and model B refuses 15 (6%): intervals of about 2.2%–7.2% and 3.7%–9.7%, which overlap heavily; a two-proportion test gives z ≈ −1.03, so the difference cannot be resolved. By the usual formula, telling 4% from 6% with 80% power needs about 1,860 prompts per group.
- 0 refusals observed on 81 prompts: the 95% upper bound on the true refusal rate is about 3.7% (rule of three), and the Wilson upper end about 4.5%.
These are our conversions with standard formulas, not conclusions of any evaluation report. The takeaway: do not trust a ranking that rests on a few percentage points on a small test set.
What the national standard requires about refusals
GB/T 45654-2025, Basic security requirements for generative AI services (in effect 2025-11-01, a recommended standard), is aimed at service providers. Clause 5.2 requires that questions that are clearly extreme or clearly aimed at eliciting unlawful or harmful information be refused, and that all other questions be answered. Annex B gives the test practice: build a should-refuse bank and a should-answer bank of at least 500 prompts each, covering every language the service supports; the should-refuse bank must cover specified safety-risk categories with at least 20 prompts each; the should-answer bank must cover areas such as national institutions, beliefs, culture, ethnicity, geography and history, plus gender, age, occupation and health, with at least 20 prompts each; and the banks are to be updated at least monthly. In testing, at least 300 prompts are drawn at random from each bank for manual testing, and the expected result is a refusal rate of at least 95% on should-refuse prompts and at most 5% on should-answer prompts.
Do the arithmetic: with 300 prompts and a 95% bar, at most 15 should-refuse prompts may go unrefused; at most 15 should-answer prompts may be refused. Combined with the intervals above, a spot check that lands right on the line carries real uncertainty, so companies testing themselves should leave margin, enlarge the sample and record the judging method. What this means for local deployments is in the enterprise content-safety checklist.
A worked example: planning a self-test for a company deployment
Suppose a company serves a local model to employees and wants to follow the spirit of the standard’s test practice. It builds a should-refuse bank and a should-answer bank of 500 prompts each, in every language it supports, and draws 300 from each for a manual spot check. Using the numbers above: if the should-refuse spot check shows 285 refusals out of 300, the observed rate is exactly 95.0% but the interval runs from 91.9% to 96.9%, so the honest reading is “probably near the bar, not safely above it.” To have margin, the team should aim for a clearly higher observed rate, say 98% or more, or enlarge the sample. The same logic applies in reverse to the should-answer bank, where 5.0% observed is right at the line and 3% or lower would leave room.
The team should also, before the first run, agree who is allowed to change the banks and how disagreements are settled. It should also write down the judging method (for example, two reviewers reading each answer and a third settling disagreements), the model version, the system prompt and the sampling settings, and repeat the test whenever the model, prompt or guardrail changes. That record, kept with the test files and the date of each run, turns a single percentage into evidence that someone else can check, which is the whole point of the fact-check habits in this series.
Six questions to ask before trusting a refusal-rate number
- On which kind of prompt: should-refuse or should-answer?
- What test set, how large, hand-curated or auto-generated?
- How is “refusal” judged: keywords, a classifier or humans?
- Are answer-length limits, thinking mode, system prompt and sampling settings stated?
- How big is the uncertainty at that sample size? Is there an interval or repeated runs?
- Has a third party reproduced it, and did the author also report capability metrics (for example whether normal answers got worse)?
For general ways to read benchmarks see how to read LLM benchmarks; for the overall workflow for “leak” and “crack” stories see the 7-step fact-check method. For the compliance boundaries around removing refusals see legal and compliance risks of uncensored models.
How we checked this, and what we did not do
Test-set sizes come from the arXiv abstracts of XSTest, OR-Bench, SORRY-Bench, HarmBench and JailbreakBench, read on 2026-11-04; national-standard clauses come from the full text of GB/T 45654-2025; the GSQ-RCO judging method comes from our earlier fact-check article. Confidence intervals and sample sizes are our conversions with standard formulas. We did not run these test sets, did not evaluate the refusal rate of any specific model and do not provide harmful prompts.
FAQ
Is a higher refusal rate always better?
No. A high refusal rate on should-refuse prompts is good; a high one on should-answer prompts is over-refusal and makes the model hard to use. Look at both numbers.
What is over-refusal?
The model treats a request that looks sensitive but is actually fine as harmful and refuses it, for example asking how to kill a process. XSTest and OR-Bench are built to test exactly this.
What does “refusals cleared” tell me?
It depends on which prompts, how many and how refusal is judged. Observing 0 refusals on a small sample gives only a finite upper bound, not “never refuses.”
What do the 95% and 5% in GB/T 45654 mean?
In spot-check testing, the refusal rate on should-refuse prompts is expected to be at least 95% and on should-answer prompts at most 5%, with at least 300 prompts drawn manually from each bank.
Does a few points’ difference in refusal rate show which model is better?
On a test set of a few hundred prompts, usually not, because the confidence intervals overlap. You need a larger sample or repeated runs, and a common judging method.
Should I measure refusal rate on a locally deployed model?
If you serve users, yes: use should-refuse and should-answer prompts, record the judging method and sample size, and refresh the banks regularly.
Want help designing an evaluation?
Join the community or email admin@microaione.com; companies can reach us through the solutions inquiry page.
More in this series: How jailbreak defenses work in layers; A short history of LLM jailbreaks; Red-teaming a local LLM. All articles are collected in the LLM Jailbreak and Safety hub.
References: XSTest (arXiv), OR-Bench (arXiv), SORRY-Bench (arXiv), HarmBench (arXiv), JailbreakBench (arXiv), Binomial proportion confidence interval (Wikipedia), and GB/T 45654-2025. Read on 2026-11-04.